
AT&S
Precision at every level.
Annual Report 2025/26
For the 2025/26 annual report of global technology group AT&S, we are responsible for the conceptual and visual design, layout, and photo editing. Our goal: to create a report that makes complexity accessible – without sacrificing depth. Technical content is brought to life through infographics, tables, and diagrams. Dedicated chapter openers with carefully selected people photography give the report structure, rhythm, and a human touch. The result: an annual report that demonstrates quality at every level – visually and editorially.
Client
AT & S Austria
Technologie & Systemtechnik Aktiengesellschaft
Project
Annual Report 2025/26
Category
Reporting, ESG, Design
Services
Concept
ESG Consulting
Project Management
Typesetting and Layout
Creation of Infographics and Charts
Tables and Data Visualizations
Image Editing/Photo Editing
Corporate Design Adaptation
Interactive/Digital PDF


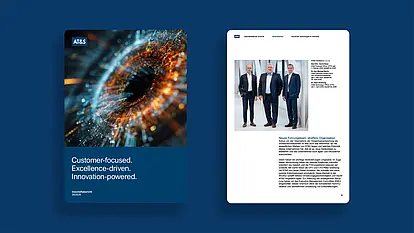
INNOVATION-POWERED – CHAPTER OPENER CONCEPT
The chapter openers give AT&S employees space: carefully selected and edited portraits and people photography put the faces of the global technology group centre stage – authentic, approachable, and within a considered visual framework. The images structure the report and create a sense of closeness to a company that operates on a global scale.
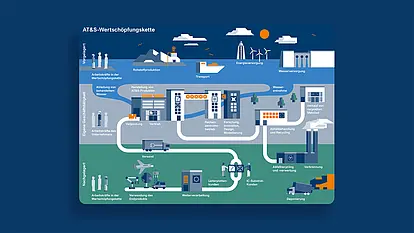
VALUE CREATION MADE VISIBLE
The value chain spans from raw material extraction to the final product in complex high-tech applications. To make these connections transparent, we developed a standalone ESG infographic that systematically maps every stage of the value chain – and shows where sustainability is actively shaped. It also works independently of the annual report, combining editorial precision with a clear, modern design: complex interdependencies become readable at a glance. A tool that doesn't just illustrate – it explains.
COMPLEXITY. MADE CLEAR.
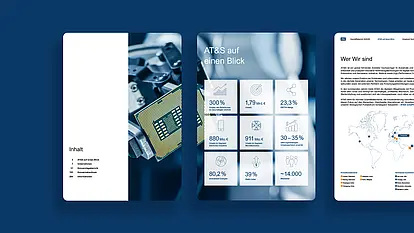
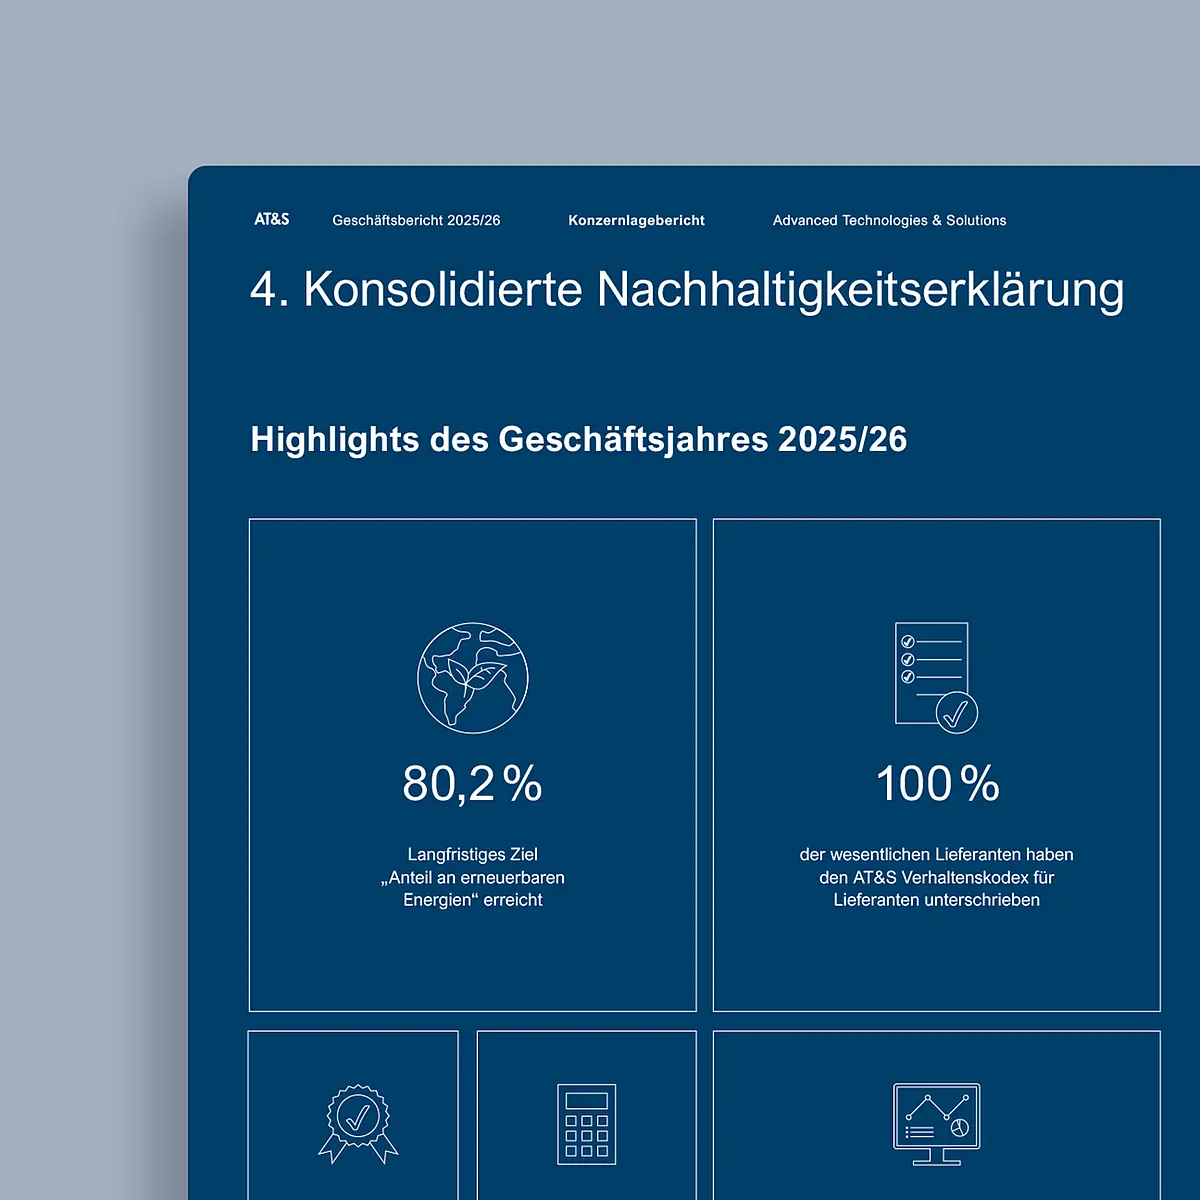
AT&S operates in a technologically demanding environment – with data, figures, and relationships that require precise presentation. We developed a consistent system of tables and charts that delivers exactly that: content that convinces at first glance.
DESIGN THAT GUIDES.
Consistent design principles ensure that readers find their bearings quickly – whether they are looking at financial figures, KPIs, or strategic data. Information hierarchy, colour system, and typography work seamlessly together. The result: tables and charts that are not only accurate – but impactful.
Say Hello.

Gina Andabaka
Consultant
gina.andabaka@kirchhoff.de
+49 40 609 186 41

Sophia Schaller
Junior Art Director
sophia.schaller@kirchhoff.de

Tori Weißenborn
Consultant ESG/Sustainability
tori.weissenborn@kirchhoff.de
+49 40 609 186 39

Thorbjörn Stäcker
Executive Director
thorbjoern.staecker@kirchhoff.de
+49 40 609 186 42

Andreas Rimmelspacher
Senior Operator
andreas.rimmelspacher@kirchhoff.de
+49 40 609 186 56